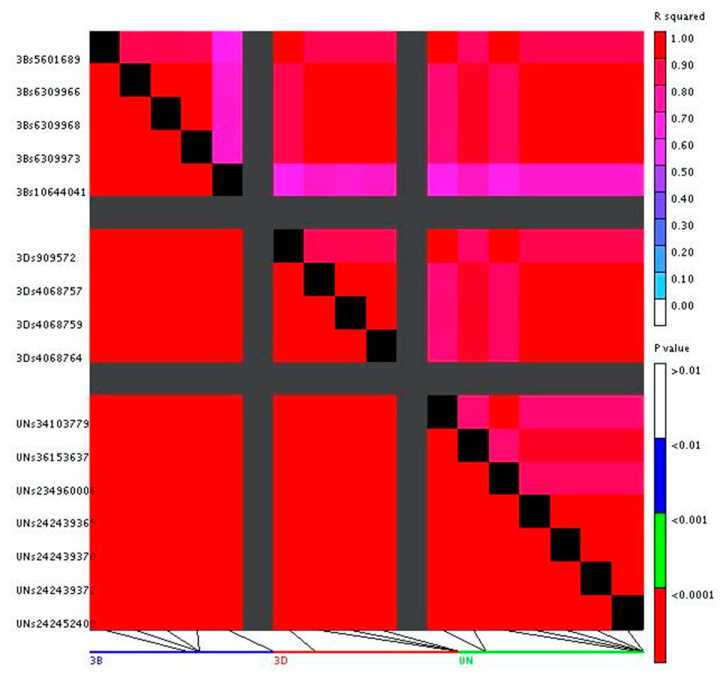
Figure 6.
Heatmap of linkage disequilibrium (LD) for significant single nucleotide polymorphisms (SNPs). Tile colors represent the R2 value for each pairwise SNP (top right half), where R2 represents the degree of association between two SNPs. Significance of association between pairs of SNPs is represented in the bottom half of the figure (the p-value of the R2 value, legend in the bottom right). The horizontal line at the bottom is each chromosome with the identified SNPs being shown as black lines pointing to the corresponding placement on the plot.

