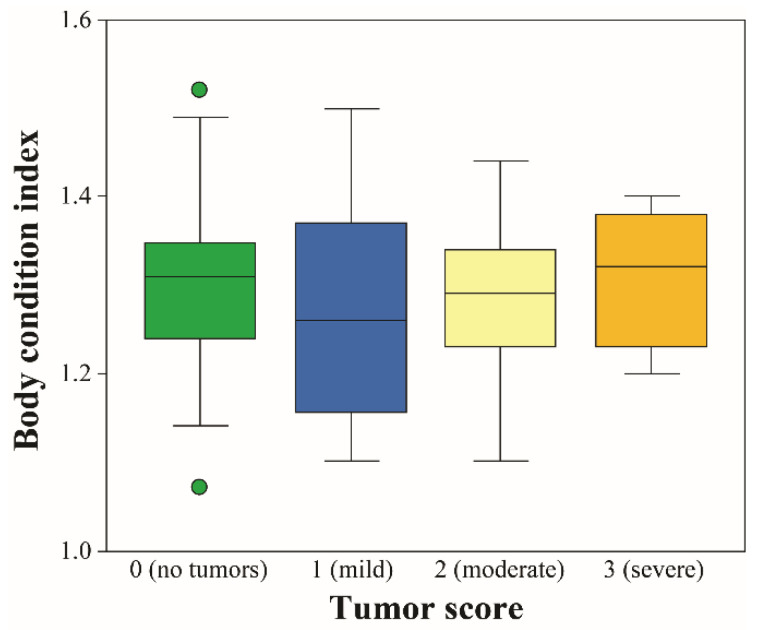
Figure 2.
Body condition index by tumor score category in green turtles (Chelonia mydas) from Florida, USA. The central boxes represent the lower to upper quartiles, with the middle line representing the median. The vertical lines extend from the minimum to maximum values. Circles indicate “outside” values that are smaller or larger than the lower or upper quartile, minus or plus 1.5-fold the interquartile range, respectively. No significant differences were observed between the different tumor score groups at p < 0.05.

