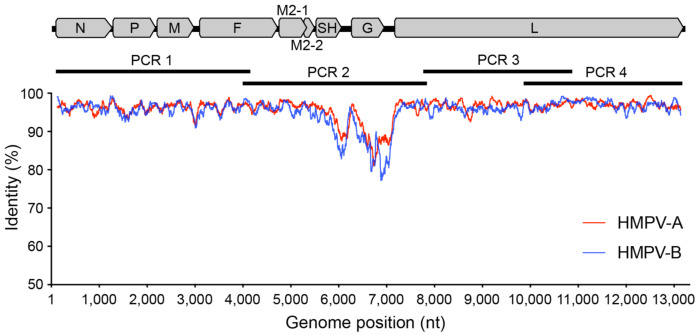
Figure 2.
Genetic variability across the HPMV genome. A graphic representation showing the percentage identity at each nucleotide position along the genome with each HMPV subtype plotted separately—A (red) and B (blue). Included also is an HMPV genome shown to scale with annotated genes to highlight primer and amplicon positions.

