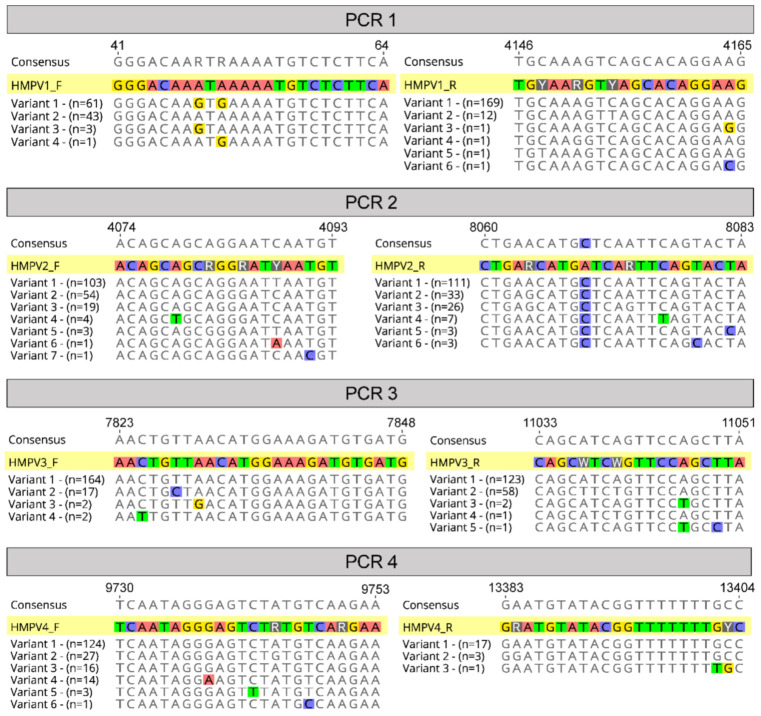
Figure 3.
Primer alignments. A graphical representation of the four chosen primer pairs aligned against known variants (sequences in the alignment) at each binding site relative to strain A1 (NCBI GenBank Accession: KU821121). Variants are different possible sequences in the alignment, and “n” refers to the number of these sequences that were observed at the primer binding sites.

