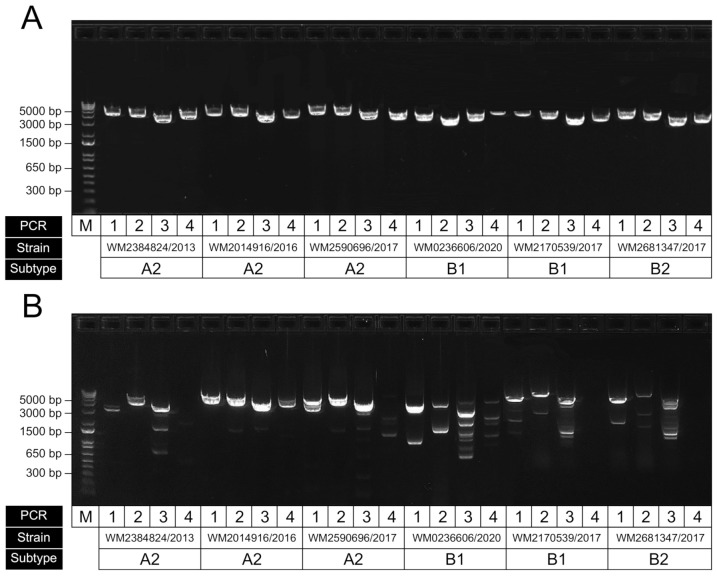
Figure 4.
Representative gel electrophoresis result showing RT-PCR performance of amplicons for HMPV genome sequencing. (A) Results for our optimised assay using our newly designed primers; (B) same samples amplified using previously published primers using the same conditions (Pollett et al., 2018). For each panel, the four amplicons for each sample have been run in sequential order, with strain ID corresponding to the original sample accession and collected year. The samples shown here were of the subtypes A2, B1 and B2, as indicated.

