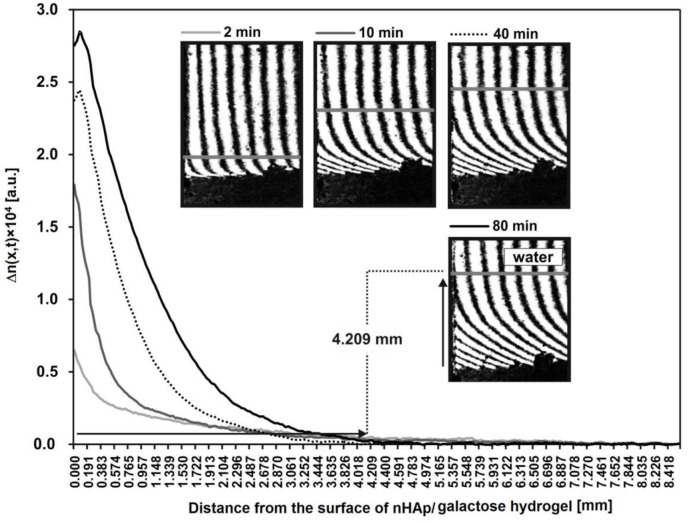
Figure 8.
The spatiotemporal distributions of refraction index changes for the hydrogel degradation products after incubation with lysozyme at 1 mg/mL (2, 10, 40 and 80 min). These distributions illustrate the spatiotemporal concentration distributions in arbitrary units. As an example, the distance of the transported hydrogel degradation products after 80 min is presented on interferogram and curve.

