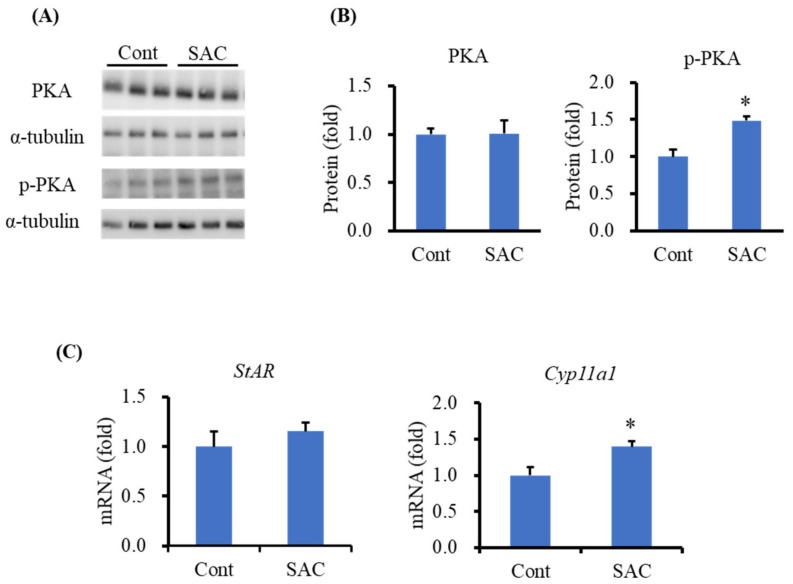
Figure 5.
SAC activates PKA in I-10 cells. (A) Western blot image of PKA and p-PKA in I-10 cells. Cells (2 × 10⁶) were incubated for 1.5 h with 100 µM of SAC. Protein expression in the cell lysate was determined by the Western blot method. (B) Quantification of PKA and p-PKA protein expression in I-10 cells. (C) The mRNA expression level of StAR and Cyp11a1 in I-10 cells. I-10 cells at a density of 106 cells per 6 cm dish were treated with 100 µM of SAC for 3 h. mRNA expression was measured by qRT-PCR. Data are presented as the mean ± SE (n = 3). Data were analyzed by Student’s t-test. * p < 0.05 compared to the control group.

