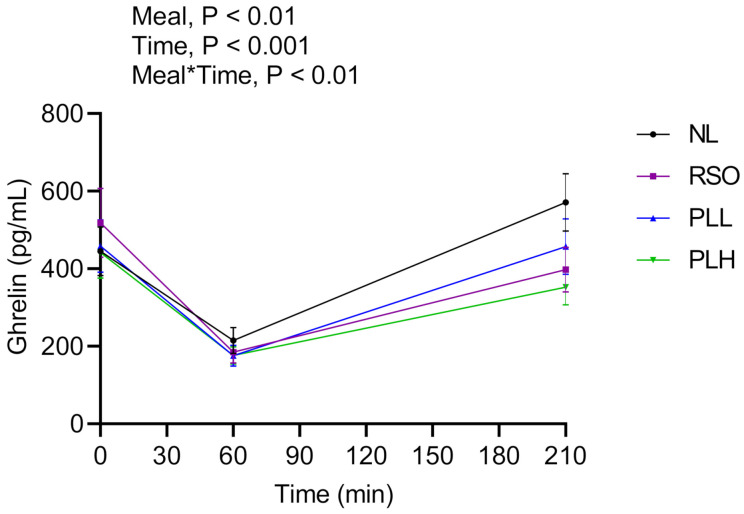
Figure 6.
Mean concentrations of ghrelin after the breakfast meals. Values are means ± SEM, n = 20 healthy subjects. Repeated measures; mixed model in SAS. NL, oat preparation without added lipids; RSO, oat preparation added with rapeseed oil; PLL, oat preparation with a low concentration of polar lipids; PLH, oat preparation with a high concentration of polar lipids.

