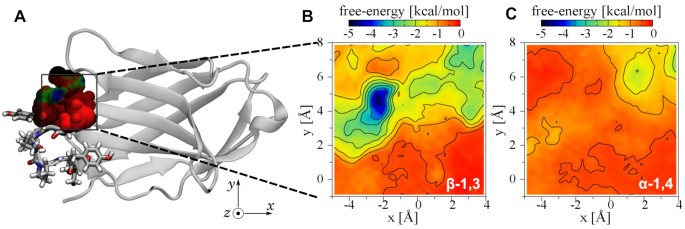
Figure 4.
Three-dimensional free-energy map for 5-mer oligoglucans in the vicinity of Met99 of CD28. The free energy is calculated as a function of the position of the central glucose monomer of a 5-mer β-1,3 oligoglucan relative to the center of mass of residue 99 of CD28. (A) Location of the mapped region of CD28. Atoms within the mapped region are shown as spheres colored according to the projected minimum free energy. (B,C) Projections of the three-dimensional free-energy map showing the minimum free energy of each line along the z-axis.

