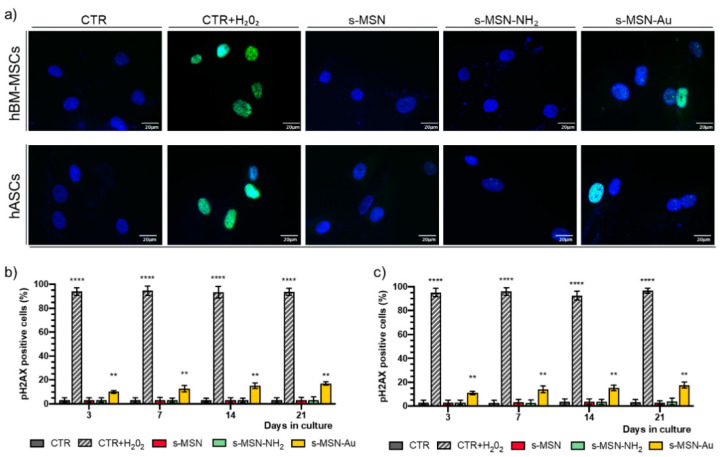
Figure 5.
(a–c) Expression of pH2AX in hBM-MSCs and hASCs. (a) Representative immunofluorescence images with anti-pH2AX antibody (Green) and Nuclei (DAPI, blue). Scale bar = 20 μm. (b,c) Quantification of pH2AX expression in hBM-MSCS (b) and hASCs (c) performed at each time point of culture. Data are expressed as mean ± SEM, ** p < 0.01 **** p < 0.0001.

