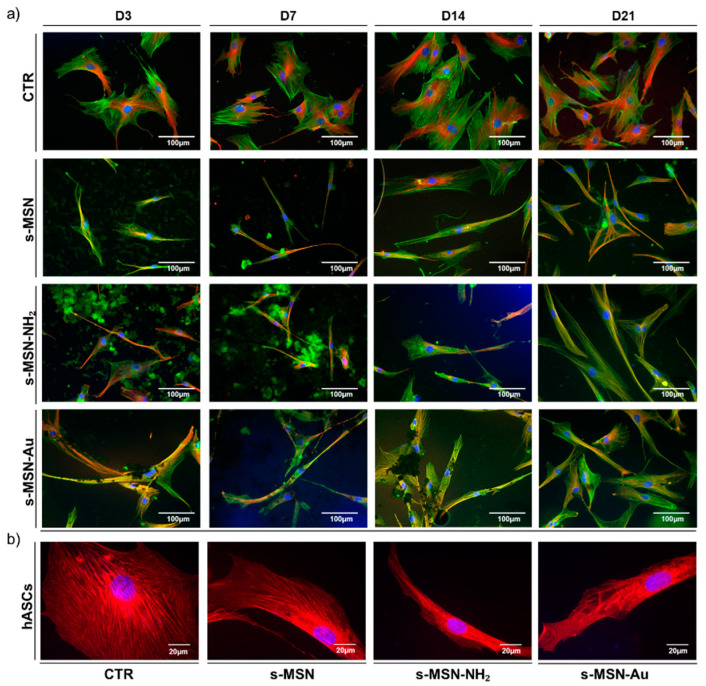
Figure 7.
Long-term culture of hASCs morphology on CTR and s-MSN, s-MSN-NH2, and s-MSN-Au. (a) Representative images of F-Actin (Phalloidin-Alexa-fluor-488, GREEN), Microtubules (anti-βTubulin antibody, RED), and Nuclei (DAPI, blue), Scale bar = 100 μm. (b) Representative images of expression of Filamin A (anti-Filamin antibody, RED), and nuclei (DAPI, blue) in stem cells on CTR and s-MSN, s-MSN-NH2, and s-MSN-Au. Scale bar = 20 μm.

