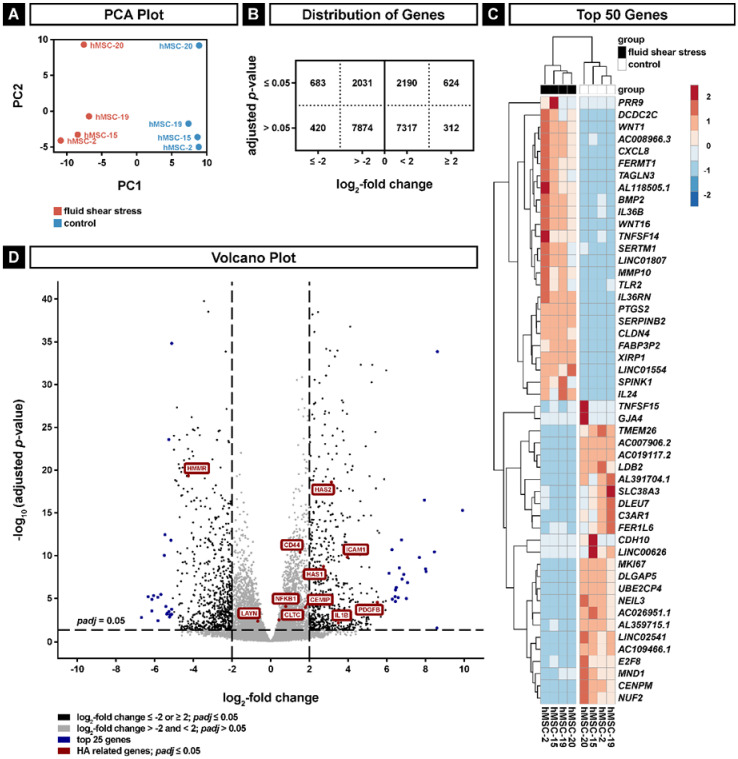
Figure 2.
Next-generation RNA sequencing analyses of hMSCs exposed to fluid shear stress. (A) Principal component analysis (PCA) for fluid shear stress (PC1) and donors (PC2). (B) Distribution of genes with more than ten reads; genes are grouped according to significance (adjusted p ≤ 0.05) and log2-fold change (≤−2 or ≥2). (C) Heatmap of the 50 most significantly regulated genes with the highest and lowest log2-fold changes. (D) Volcano plot of genes with more than ten reads. Dashed lines show thresholds for significance (p ≤ 0.05) and log2-fold change (≤−2 or ≥2). The top significantly regulated genes with the highest and lowest log2-fold change are shown in blue; the significantly changed genes of the hyaluronan biosynthetic pathway (GO:0030213) and the significantly changed hyaluronan (HA) receptors CD44, HMMR, ICAM1 and LAYN are shown in red.

