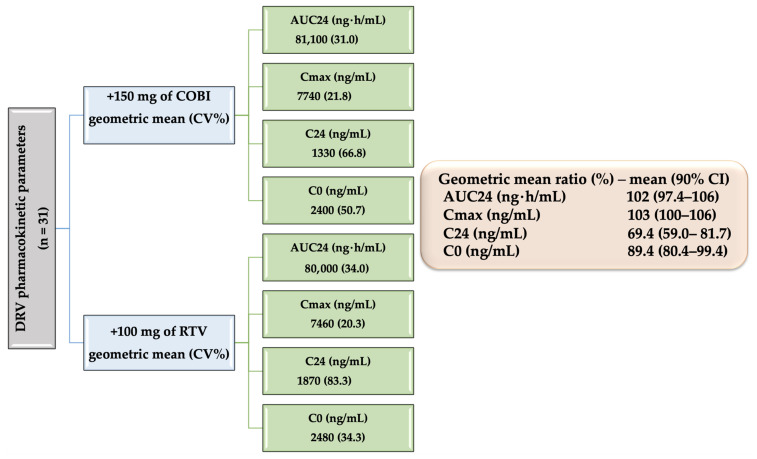
Figure 9.
Comparison of pharmacokinetics of 800 mg DRV when co-administered with 150 mg COBI or 100 mg of RTV. Legend: AUC—area under the curve (area under the plot of plasma concentration of a drug vs. time, after dosage); C0—initial concentration; C24—concentration at 24 h; Cmax—maximum concentration; CV—coefficient of variation.

