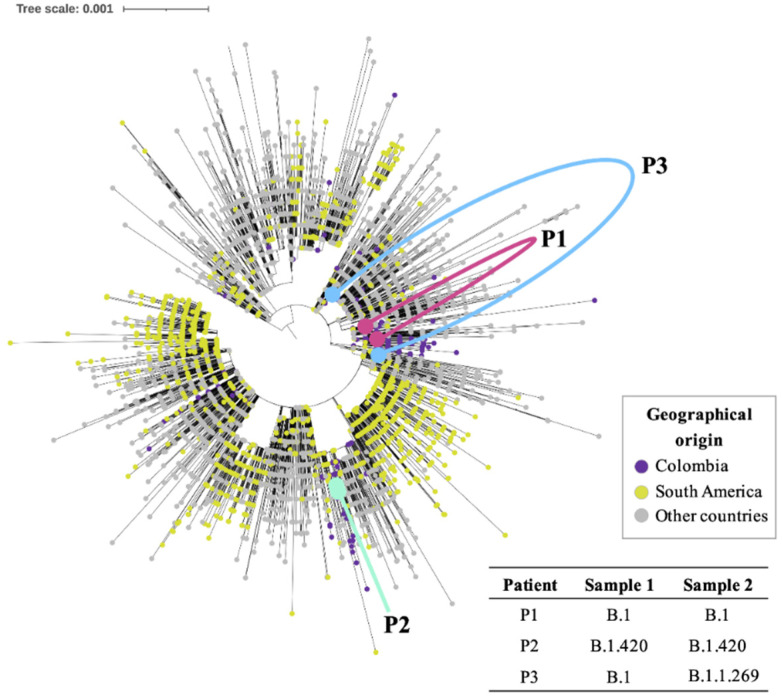
Figure 2.
Phylogenomic reconstruction of the six genomes sequenced in this study compared to the 4171 genomes encompassing the global diversity of SARS-CoV2. The red dots and lines represent Patient 1 (persistence); the turquoise dots and lines represent Patient 2 (persistence); and the blue dots and lines represent Patient 3 (reinfection).

