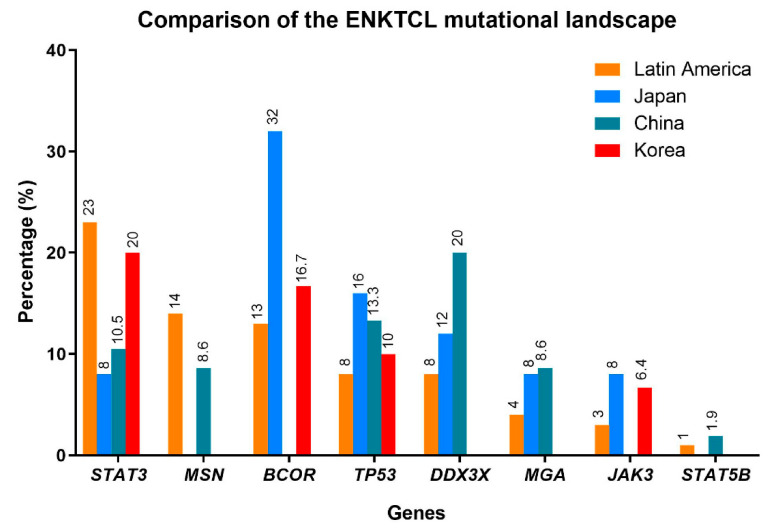
Figure 2.
Comparison of the ENKTCL mutation landscape in different populations. The frequency of the mutations of the most common altered genes among these populations is depicted as percentages. The colors indicate the different populations in four different studies: Latin America (orange) [82], Japan (blue) [23], China (green) [22], and Korea (red) [20].

