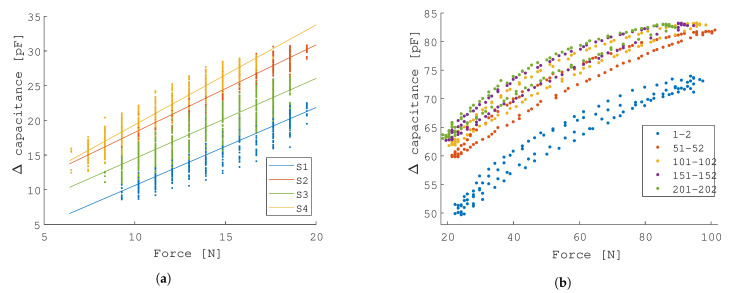
Figure 8.
Test-bench characterization results (B): the four printed sensors exhibit negligible differences in response. On cyclic experiment, the drift of the sensor can be observed. After 100 cycles, the drift settles. (a) Four pressure sensor were printed and assessed. A cyclic load at a frequency of 0.1 Hz is applied. (b) A cyclic experiment at 0.1 Hz to explore the wide sensing range of the sensor, the hysteresis that is exhibited, and the drift in a dynamic setup.

