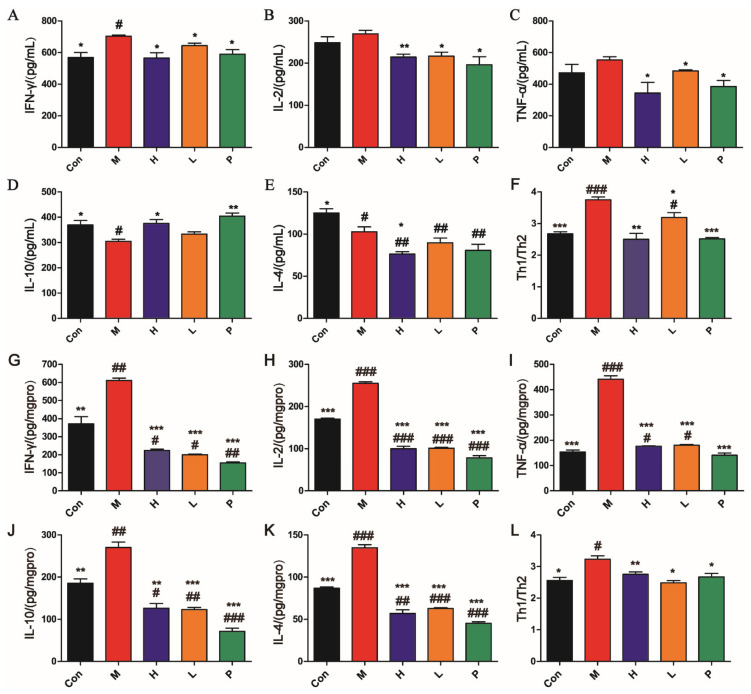
Figure 5.
Effects of OPA on cytokines in serum (A–F) and colon tissues (G–L). Levels of IFN-γ (A), IL-2 (B), TNF-α (C), IL-10 (D), IL-4 (E), and Th1/Th2 (F) in serum and levels of IFN-γ (G), IL-2 (H), TNF-α (I), IL-10 (J), IL-4 (K), and Th1/Th2 (L) in colon tissues. Con was control group, M was model group, H was the high dose OPA group, L was low dose OPA group, P was positive group. Data were expressed as the mean ± SD (n = 6), the statistical analyses were done with t-test; *** p < 0.001, ** p < 0.01, * p < 0.05 compared with the model group; ### p < 0.001, ## p < 0.01, # p < 0.05 compared with the control group.

