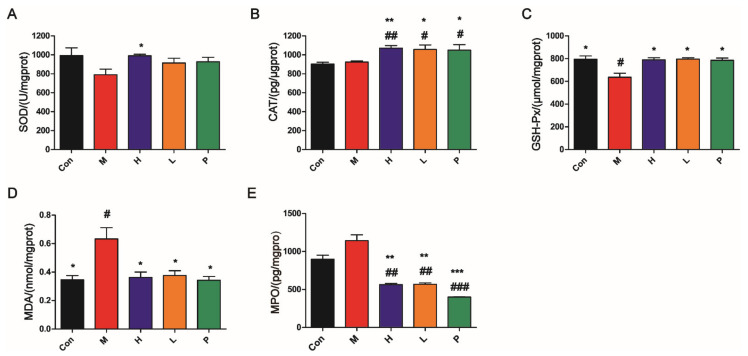
Figure 7.
OPA suppressed oxidative stress in vivo. (A–C) Effects of OPA on SOD (A), CAT (B), and GSH-Px (C) (antioxidant enzyme) in liver; (D) effects of OPA on MDA (maker of oxidative stress) in liver; (E) effects of OPA on MPO in colon. Con was control group, M was model group, H was the high dose OPA group, L was low dose OPA group, P was positive group. Data were expressed as the mean ± SD, the statistical analyses were done with t-test; *** p < 0.001, ** p < 0.01, * p < 0.05 compared with the model group; ### p < 0.001, ## p < 0.01, # p < 0.05 compared with the control group.

