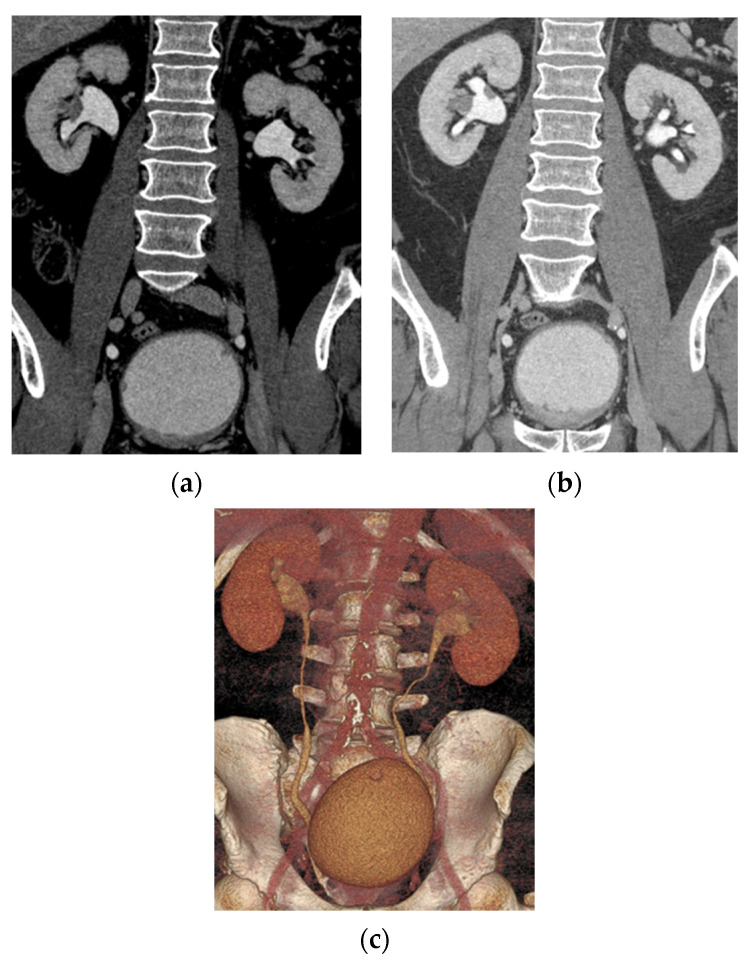
Figure 2.
CT urogram showing synchronous upper and lower tract urothelial carcinoma. (a) Coronal CT image in the excretory phase shows multiple small bladder lesions (solid white arrow) and synchronous upper tract disease (dashed white arrow) (b) Coronal CT image slightly posteriorly, showing multiple upper tract lesions. (c) Coronal 3D volume rendering redemonstrates the findings with another bladder lesion (black arrow).

