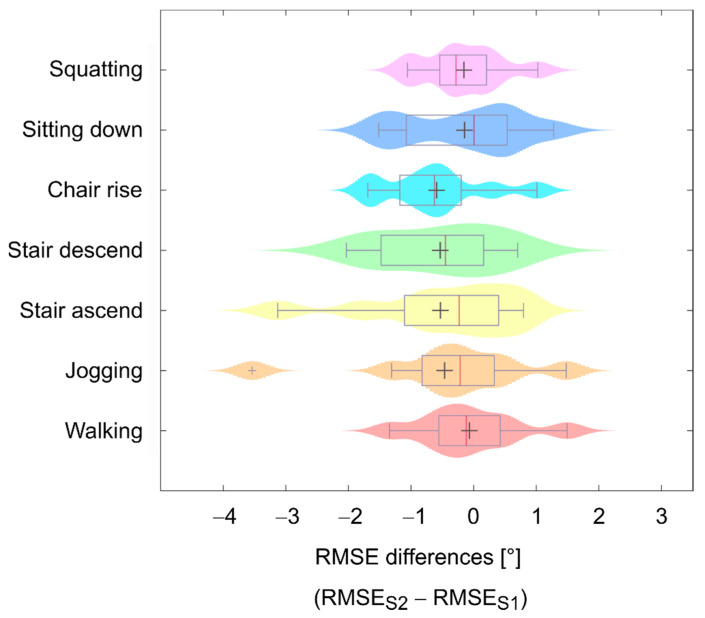
Figure 5.
Distribution of root mean square error (RMSE) differences between session 1 (S1) and session 2 (S2) for each investigated activity obtained from the subgroup of nine participants; mean differences within the boxplots are represented by grey crosses, median differences within the boxplots are represented by red vertical lines, shaded areas represent the probability density of the data; the wider shaded areas indicate an accumulation of datapoints and narrow shaded areas, which are mostly present at the edges of each distribution, indicate scattered data points.

