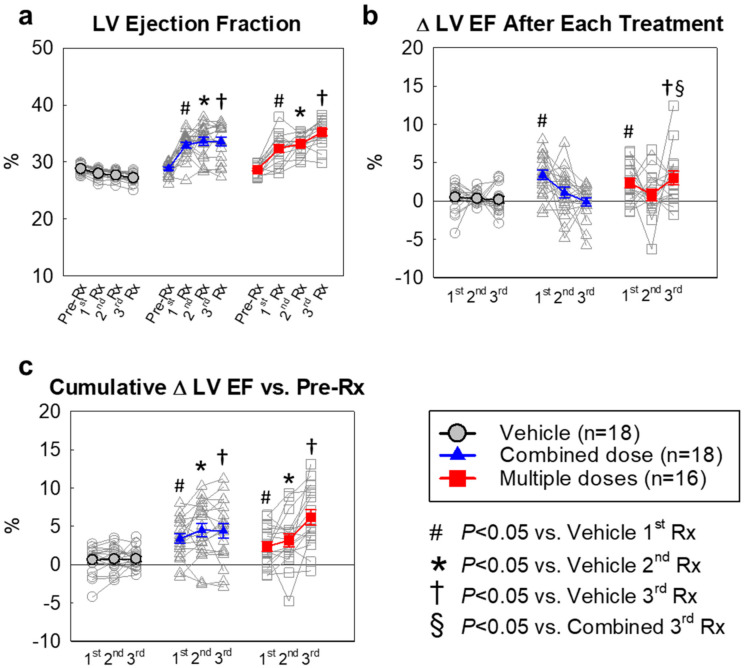
Figure 2.
Echocardiographic assessment of left ventricular ejection fraction (LVEF). We interpreted the LVEF value in several different ways (Table 1,Table 2 and Table 3): (a) Values of LVEF in individual mice; (b) Changes in LVEF (absolute units) after the 1st, 2nd, and 3rd treatments compared with the respective pre-treatment values; (c) Cumulative changes in LVEF (absolute units) after the 1st, 2nd, and 3rd treatments compared with the values measured before the 1st treatment. All data are represented as the mean ± SEM.

