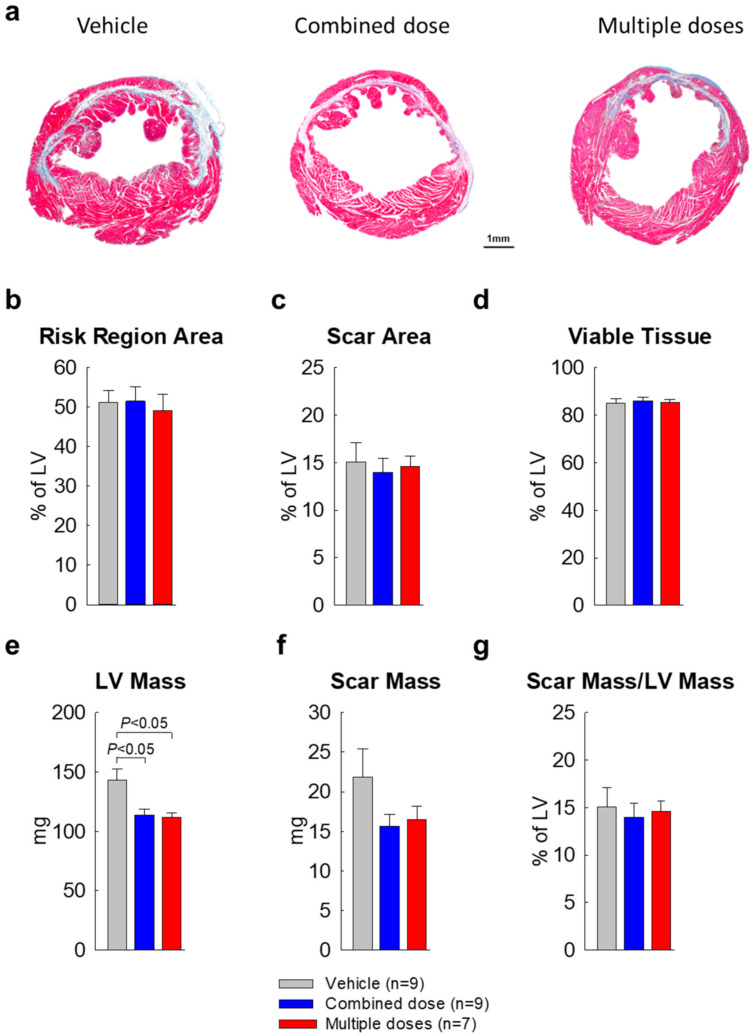
Figure 4.
Morphological and histological assessments (n = 7~9/group). Masson’s trichrome–stained images were used for LV morphological measurements. (a) Representative Masson trichrome-stained myocardial sections. Scar tissue and viable myocardium are identified in white/blue and red, respectively; (b) Risk region area as percentage of LV area; (c) Scar area as percentage of LV area; (d) Viable tissue area as percentage of LV area; (e) LV mass; (f) Scar mass; (g) Scar mass/LV mass ratio. All data are represented as the mean ± SEM.

