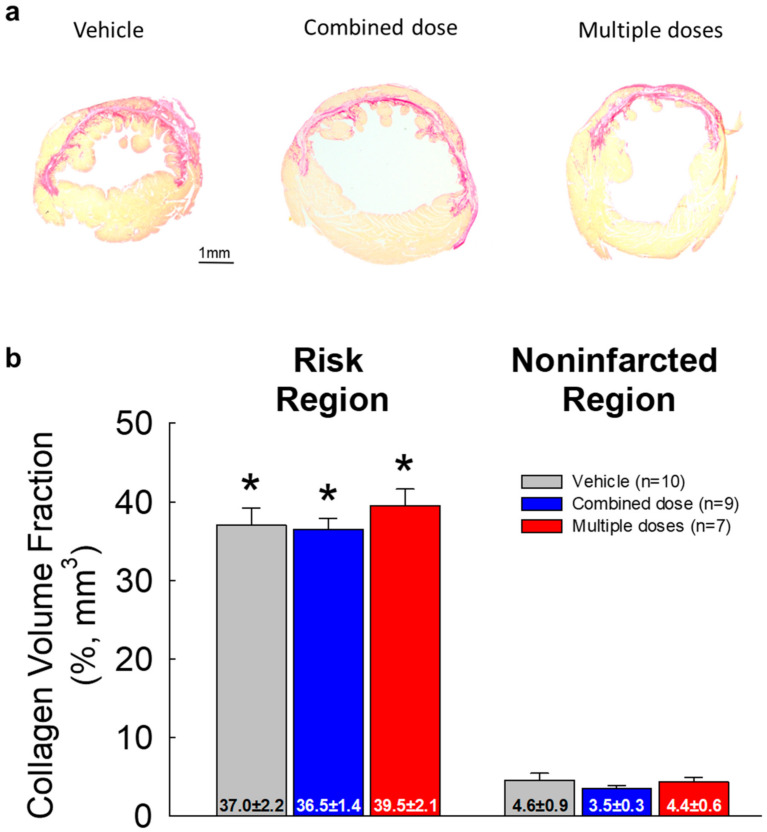
Figure 5.
Myocardial collagen content (n = 7~9/group). (a) Representative images of LV sections stained with picrosirius red. Images were acquired under polarized light microscopy; (b) quantitative analysis of collagen volume fraction (mm3) expressed as a percentage of the risk and noninfarcted region. All data are represented as the mean ± SEM. * p < 0.05.

