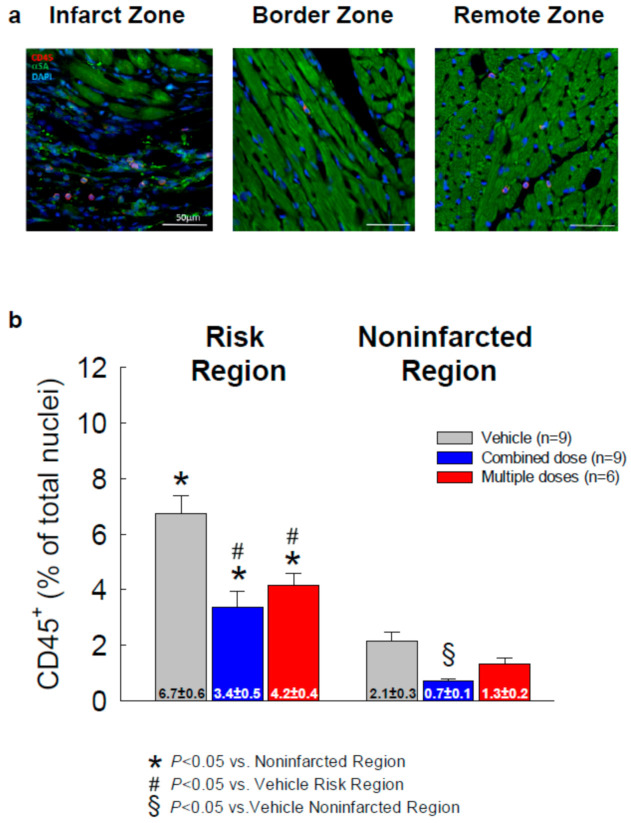
Figure 7.
Myocardial content of inflammatory cells. (a) Representative microscopic images of LV sections stained for CD45 (red), α-sarcomeric actin (green), and DAPI (blue); (b) quantitative analysis of the number of CD45+ cells in the risk and noninfarcted regions expressed as a percentage of total cells counted in the corresponding region. All data are represented as the mean ± SEM.

