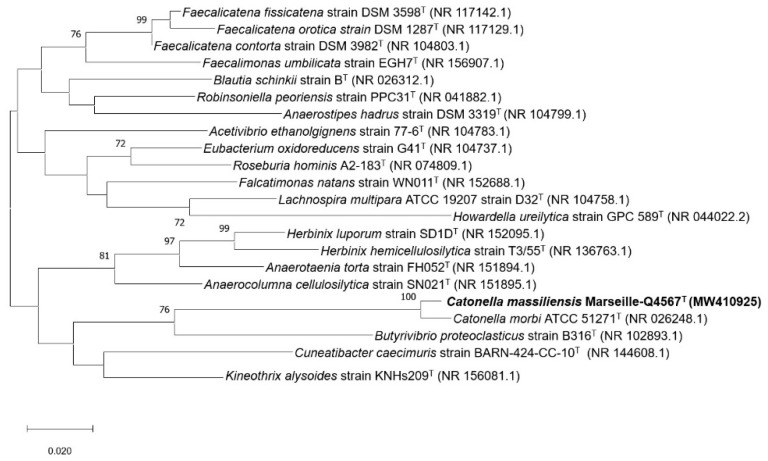
Figure 4.
Maximum likelihood tree based on the comparison of 16S rRNA gene sequences showing the phylogenetic relationships of Catonella massiliensis Marseille-Q4567T and other closely related species. Bootstrap values (expressed as percentages of 1000 replications) are displayed at the nodes. Only bootstrap values of 70% or greater are shown. Type strains are indicated with superscript T. GenBank accession numbers of 16S rRNA indicated in parentheses. Sequences were aligned using MUSCLE with default parameters, phylogenetic inference was obtained using the Maximum likelihood method and MEGA X software [22]. Bootstrap values obtained by repeating the analysis 1000 times to generate a majority consensus tree are indicated at the nodes. There was a total of 1392 positions in the final dataset.

