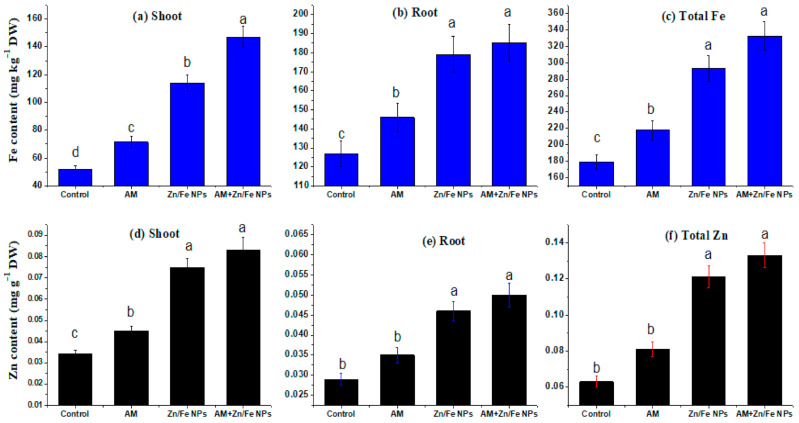
Figure 7.
ZnFe2O4 NPs and AM fungal effects on Fe content (mg/kg DW) (a–c) and Zn content (mg/g DW) (d–f) in shoot, root and their total contents in pea plants respectively. Control (non-treated pea plants); AM (pea plants inoculated with AM fungi); Zn/Fe NPs (pea plants treated with ZnFe2O4 NPs) and AM+ Zn/Fe NPs (pea plants dually treated with AM fungi and ZnFe2O4 NPs) pea plants. Data are the mean of three replicates ± standard error (n = 3). Different letters above bars indicate a significant difference between treatments using ANOVA followed by Duncan’s multiple range test (p < 0.05). DW, dry weight.

