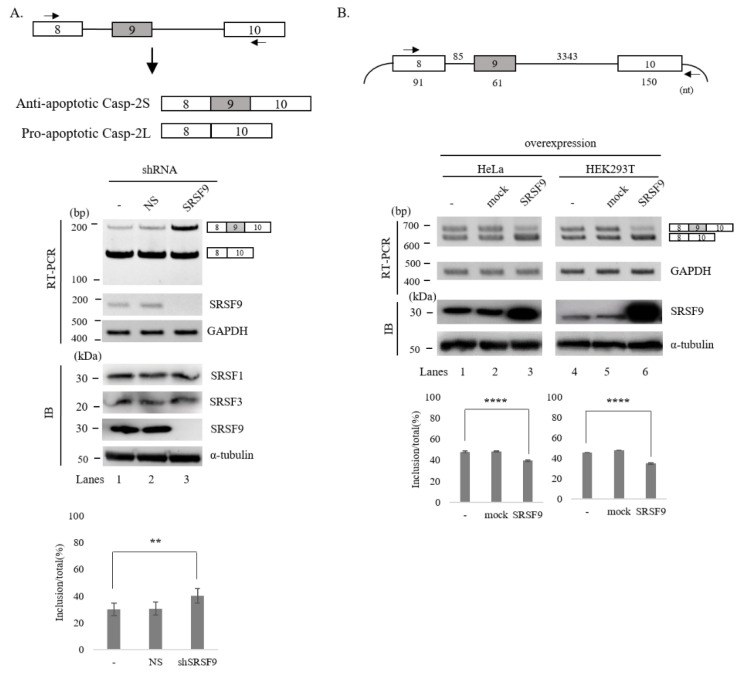
Figure 1.
SRSF9 regulates AS of Caspase-2 pre-mRNA. (A)-(Upper) Schematic AS representation of endogenous Caspase-2 pre-mRNA. Primers used in RT-PCR are shown with arrows. (Middle) RT-PCR analysis of endogenous Caspase-2 pre-mRNA from untreated, ns- and SRSF9 shRNA treated cells. GAPDH was used as a loading control. Results of immunoblotting with anti-SRSF9 in these cells are shown, with α-tubulin, SRSF1 and SRSF3 as a controls. (Lower) Statistical differences of RT-PCR with p values are shown, ****, p < 0.0001 and **, p < 0.01. (B)-(Upper) Schematic representation of Caspase-2 minigene. Exons are shown with boxes and introns are shown with lines. Lengths of each part are shown. Primers used in RT-PCR analysis are shown with arrows. (Middle) RT-PCR analysis of Caspase-2 minigene from untreated, empty vector treated and SRSF9 expression plasmid treated HeLa and HEK293T cells. GAPDH was used as a loading control. Immunoblotting with anti-SRSF9 antibody is shown, with α-tubulin as a control. (Lower) Statistical differences of RT-PCR analysis are shown, ****, p < 0.0001; and **, p < 0.01.

