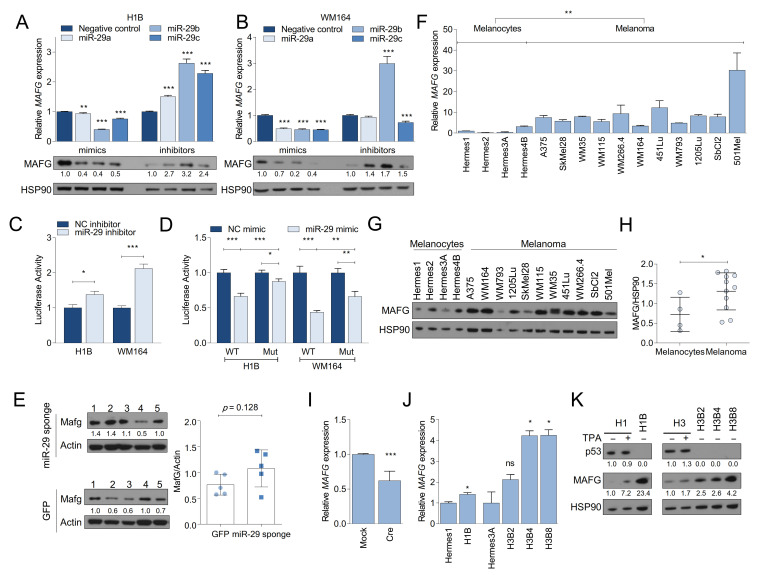
Figure 5.
MAFG is a target of miR-29 and deregulated in melanoma. (A,B) MAFG mRNA (upper panels) and protein (lower panels) expression in response to transfection with miR-29 mimics (left) or inhibitors (right) in H1B melanocytes (A) or WM164 melanoma cells (B). The mean ± SEM of one representative out of two independent experiments performed in triplicates is shown. mRNA expression is normalized to GAPDH; (C) activity of MAFG 3′UTR Luciferase reporter in response to miR-29 inhibitors; (D) activity of MAFG wildtype or miR-29 binding site-mutant 3′UTR Luciferase reporter in response to miR-29 mimics. For (C,D), the combined mean ± SEM of two independent experiments performed in quadruplicates is shown; (E) Western blot showing MAFG expression in GFP and miR-29 sponge melanomas isolated from BrafV600E; PtenΔ/WT chimeras; (F) qRT-PCR showing the basal expression levels of MAFG mRNA in melanocytes and melanoma cells. The mean ± SEM of one representative out of two independent experiments performed in triplicates is shown. Expression is normalized to GAPDH; (G) Western blot showing the expression levels of MAFG protein in melanocytes (n = 4) and melanoma cells (n = 11); (H) Quantification of the Western blot shown in (G); (I) qRT-PCRs showing the expression of MAFG in LSL-BrafV600E PMM following Adeno-Cre/Mock infection; (J) qRT-PCR showing the expression levels of MAFG mRNA in parental and BRAFV600E-mutant melanocytes. The mean ± SEM of one representative out of two independent experiments performed in triplicates is shown. Expression is normalized to GAPDH; (K) Western blot showing MAFG expression in human melanocytes in response to TPA stimulation or chronic BRAFV600E expression. The mean ± SEM of one representative out of two independent experiments performed in triplicates is shown. All Western blots show the intensity ratio of the protein of interest normalized to HSP90 or Actin. * p < 0.05; ** p < 0.01; *** p < 0.001.

