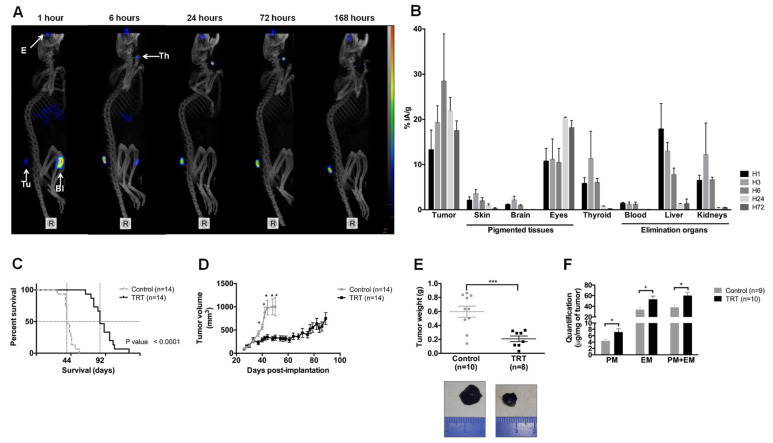
Figure 3.
[131I]ICF01012 biodistribution and efficiency in an NRAS-mutant murine model. Results are presented as mean +/− SD (D,F) and as median, 1st quartile, and 3rd quartile (E). (A) Maximum intensity projection from SPECT-CT imaging of the same mouse from 1 h post-injection to 168 h shows tumor (Tu), eyes (E), thyroid (Th), and bladder (Bl) fixation of [131I]ICF01012. (B) Biodistribution of [131I]ICF01012, expressed as the percentage of injected activity/gram, was determined for each timepoint and each non-target organ by activity count (n = 3 mice per timepoint). (C,D) Survival curve (C) and tumor growth (D) were determined using 14 animals for each group. (E) Tumor weight for 10 control mice and eight TRT-treated mice, sacrificed 10 days after treatment, illustrated by 2 tumors representative of observed differences between control and TRT tumors. (F) Pheomelanin (PM) and eumelanin (EM) were quantified for nine control tumors and 10 TRT tumors. (* p < 0.05, *** p < 0.001).

