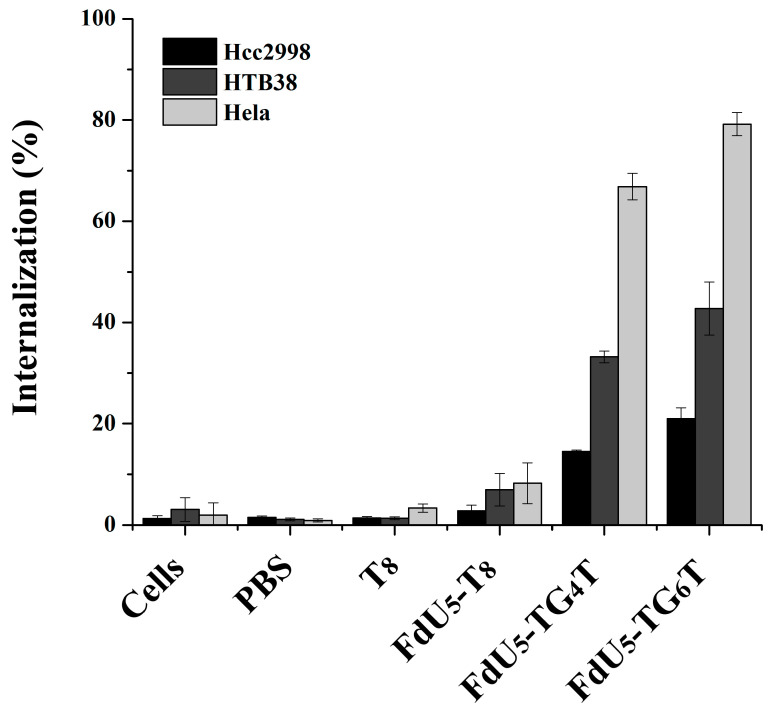
Figure 2.
Intracellular uptake of G-quadruplex nanostructures HeLa, and two colorectal cancer cells (HCC2998 and HTB38). Cells were incubated separately with the native and modified G-quadruplexes at 1 µM concentration, and the internalization is shown in the bar graphs HCC2998 (black), HTB38 (dark grey) and HeLa (light grey). Error bars represent the standard deviation (SD) of two independent experiments in duplicate.

