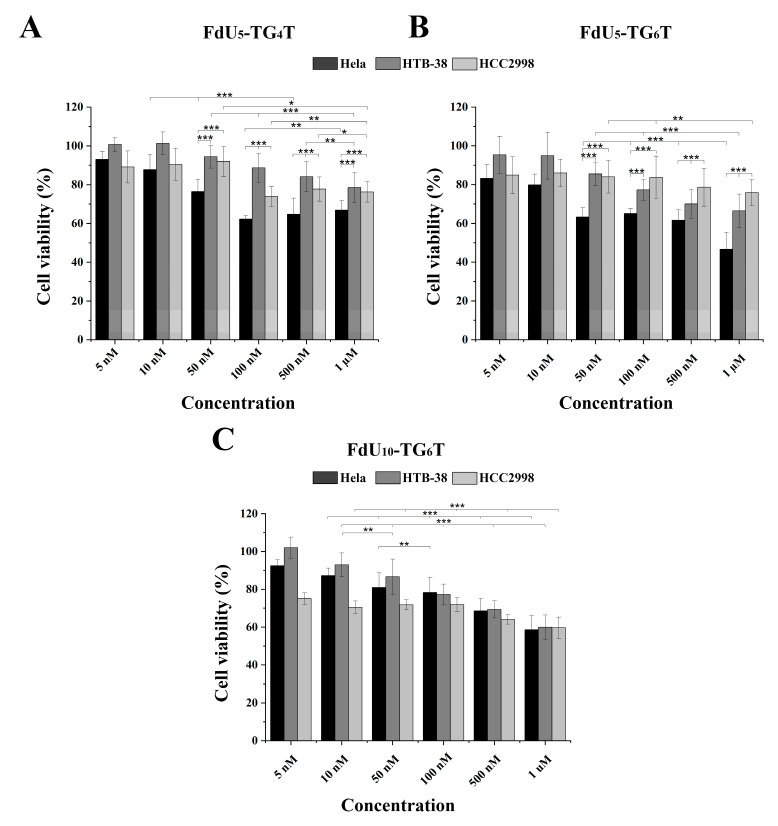
Figure 3.
MTT cytotoxicity assay for the three DNA G-quadruplexes nanostructures in the HeLa (black), HTB-38 (dark grey) and HCC2998 (light grey). Cells were treated with (FdU)5-TG4T (panel (A)) and (FdU)5-TG6T (panel (B)) FdU10-TG6T (panel (C)) at a range of concentrations from 5 nM to 1 µM in panel A and B and 10 nM to 1 µM in panel C. Error bars represent the standard deviation (SD) of three independent experiments in triplicate (n = 9). * corresponds to t-test results with * p ≤ 0.1, ** p ≤ 0.05, *** p ≤ 0.01 significantly different within each indicated pair.

