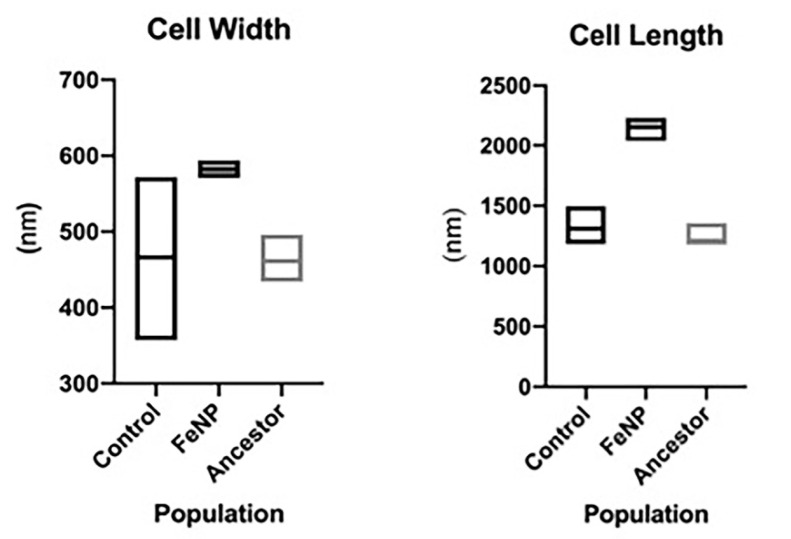
Figure 4.
Bacteria cell width and length distribution. Box plots of E. coli MG1655 mean cell width and length for FeNP compared to controls and ancestors is shown. The sample size was N = 20 cells per replicate population measures in the FeNP and control populations for a total of 100 cells per selection treatment. Sample size for ancestors was 15 for each replicate, for a total of 75 cells.

