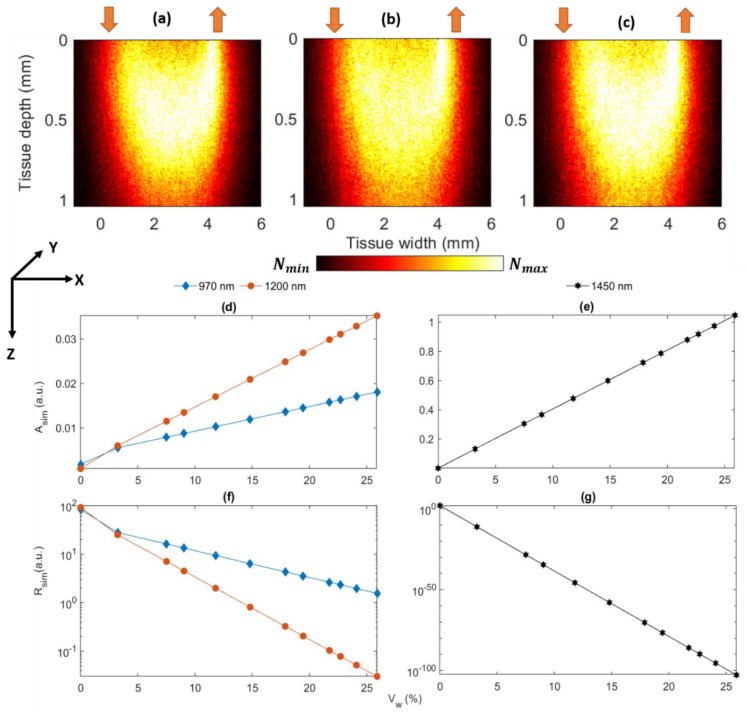
Figure 5.
Monte Carlo simulation results at the wavelengths 970, 1200, and 1450 nm. The light–tissue interaction profiles are shown in (a–c). In the reflectance sensor geometry, the source (upward red arrow) and the detector (the downward red arrow) are separated by a distance of 5 mm. The simulations were carried out with the maximum hydrated skin at all wavelengths. Tissue depth and width are presented along the z- and x-axis, respectively. The variations in the simulated absorbance Asim and reflectance Rsim (presented in the logarithmic scale) with the increasing dermal water volume Vw (expressed in percentage) are shown at 970 and 1200 nm in (d,f), and at 1450 nm at (e,g), respectively.

