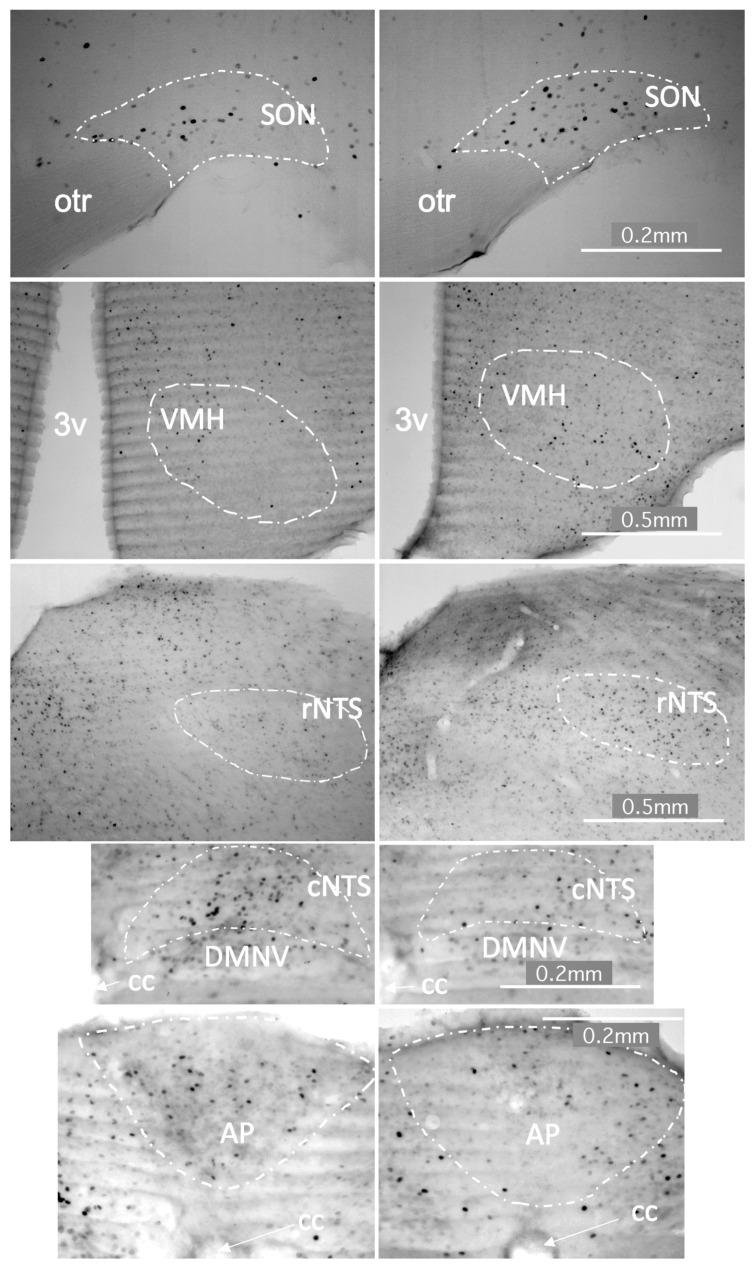
Figure 5.
Photomicrographs depicting feeding-related brain sites in which c-Fos immunoreactivity was different after ingestion of the same volume of the 20:80 (left panel) vs. 60:40 (right panel) whey:casein milk formulation. 3v–third ventricle, AP–area postrema, cc–central canal, cNTS–caudal nucleus of the solitary tract, DMNV–dorsomedial nucleus of the vagus, otr–optic tract, rNTS–rostral nucleus of the solitary tract, SON–supraoptic nucleus, VMH–ventromedial hypothalamic nucleus. Scale bar–0.2 mm (for photographs depicting the SON, cNTS and AP) and 0.5 mm (for VMH and rNTS photographs).

