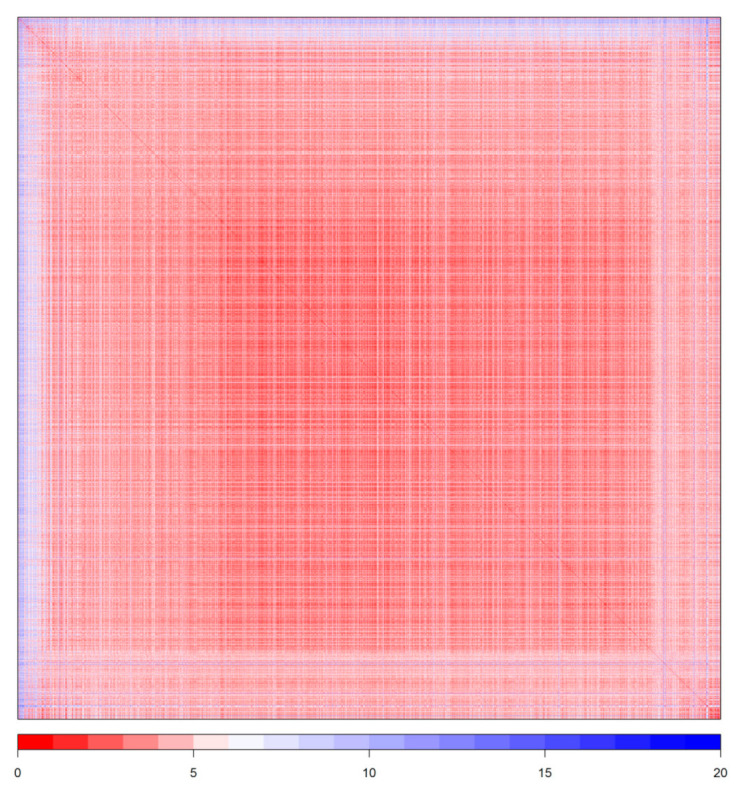
Figure 1.

Dissimilarity plot based on the Tanimoto coefficient for the training data set used in this study. Lower values (more intense red) indicate lower dissimilarity (zero values showing identity the diagonal line). Spectral seriation was used between clusters and multidimensional scaling (“MDS”) within clusters.
