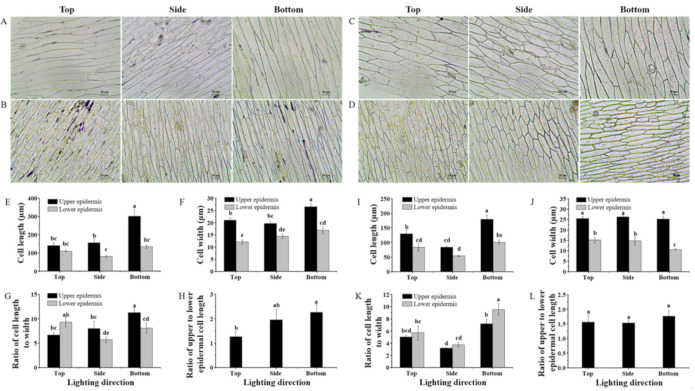
Figure 2.
Upper and lower epidermal cell morphology of lettuce Caesar Green (A,B) and Polla (C,D), cell length and width, ratio of cell length to width, and ratio of the upper and lower epidermal cell lengths of lettuce Caesar Green (E–H) and Polla (I–L) as affected by the lighting direction. Vertical bars indicate the means ± stand error (n = 3). Different small letters indicate the significant separation within treatments by the Duncan’s multiple range test at p ≤ 0.05. Bars indicate 20 μm.

