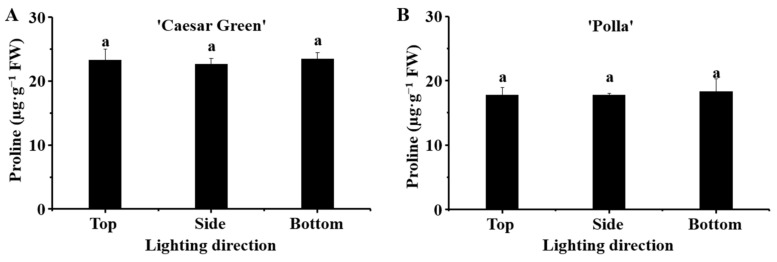
Figure 5.
Effect of the lighting direction on the proline content in leaves of lettuce Caesar Green (A) and Polla (B). Vertical bars indicate the means ± stand error (n = 3). Different small letters indicate the significant separation within treatments by the Duncan’s multiple range test at p ≤ 0.05.

