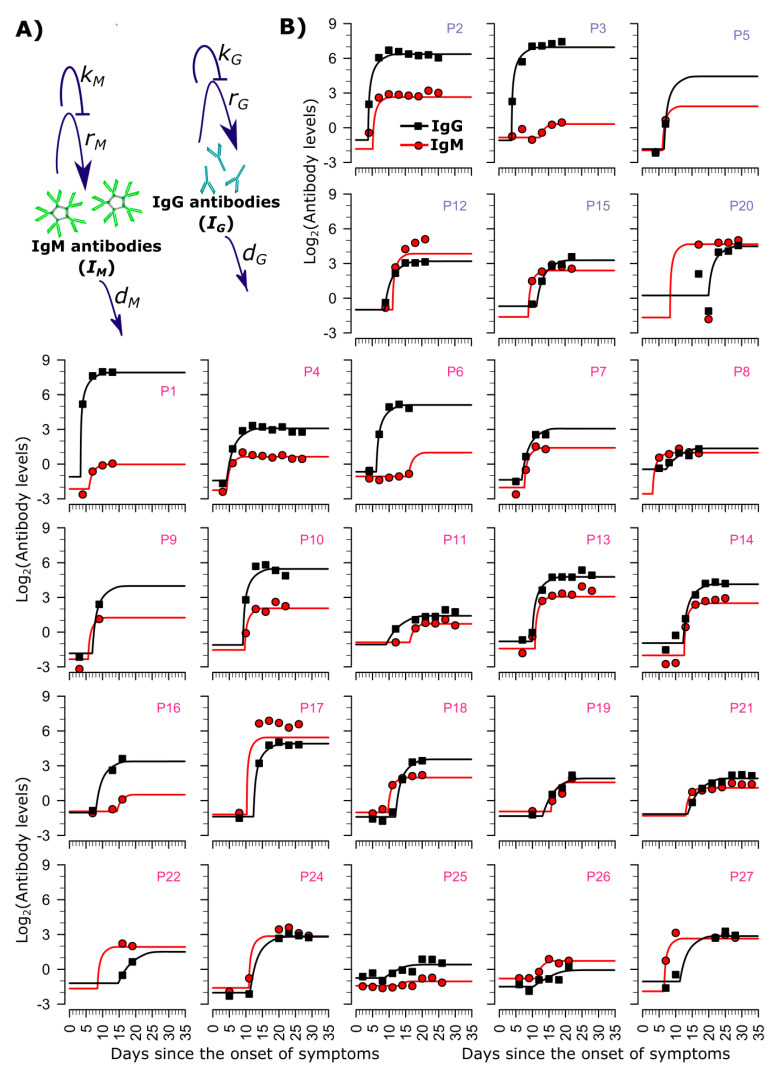
Figure 1.
The mathematical model fits SARS-CoV-2 IgG and IgM levels following infection. (A) Schematic representation of the mathematical model reproducing longitudinal IgM and IgG dynamics, where and stand for the antibody production rates, and regulate the saturation of antibody generation, and are the natural clearance rates of IgM and IgG, respectively. The parameters used here correspond to the parameters in Equation (3) from the Materials and Methods section (or, model M3 in Table S1), (B) Simulations (line), and data (markers) of IgM (red) and IgG (black) under the best model (model M3 in Table S1). Severe and non-severe patients are labeled in blue and pink, respectively.

