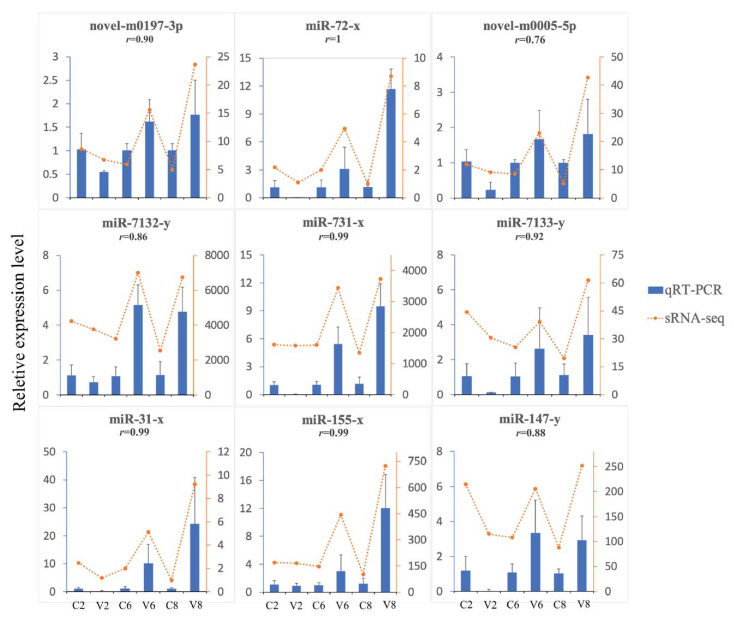
Figure 3.
Validation of the small RNA-seq data by quantitative real-time PCR (qRT-PCR). The relative expression profiles of 9 DEmiRs, at 2, 6, or 8 days post infection, detected by qRT-PCR (bars) and compared with the results of RNA-seq (dotted lines). Error bars represent standard deviations. For each DEmiR, the correlation coefficient (r) between the results of qRT-PCR and sRNA-seq is shown.

