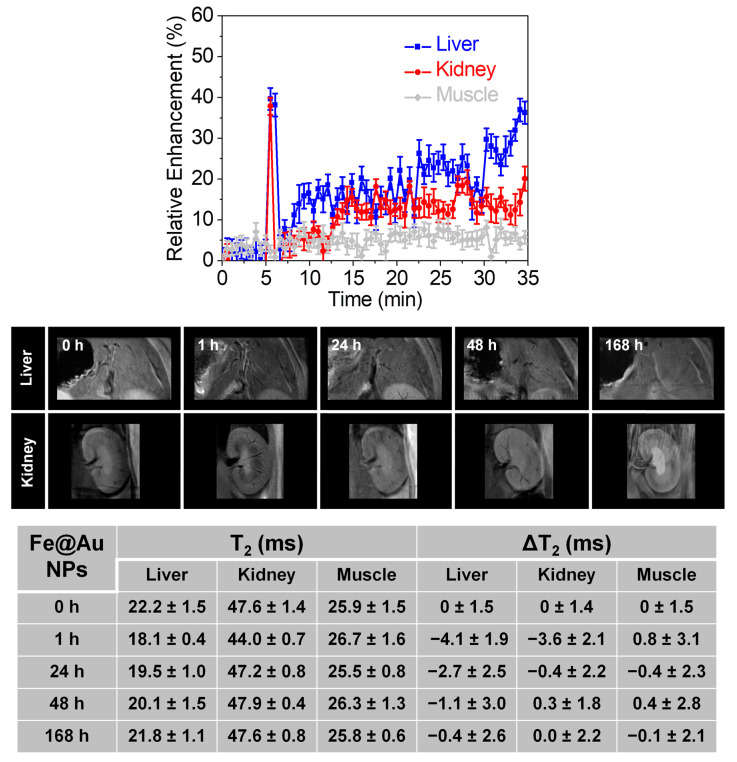
Figure 7.
(top) In vivo pharmacokinetics after intravenous injection in mice of Fe@Au NPs in the liver (blue), kidneys (red), and muscle (grey). (bottom) Representative T2-weighted MRI images of liver and kidneys at different time points after the intravenous injection of NPs. The table shows T2 and ΔT2 values in the liver, kidneys, and muscle at different time points after the intravenous injection of Fe@Au NPs. Values correspond to the mean ± SD (n = 3).

