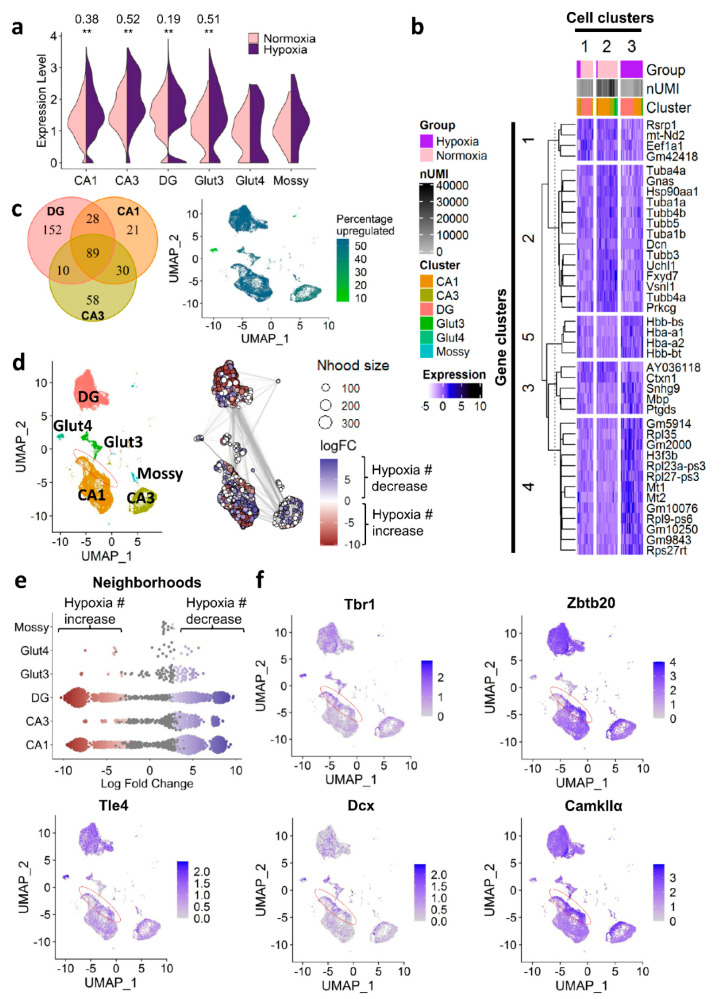
Figure 6.
Response of hippocampal excitatory neurons to hypoxia evaluated by scRNA-seq. (a) Upregulation of CaMKIIα under hypoxia (five days, 6% O2 for 6 h/day) in excitatory neurons of the hippocampus. (b) Heatmap of top 20 upregulated and top 20 downregulated genes under hypoxia. Columns represent cells, rows represent genes. Scaled normalized expression shown. Cells and genes were clustered using the k-means algorithm. Number of unique molecular identifiers per cell: nUMI. (c) Left panel: Venn diagram depicting number of shared and uniquely regulated genes under hypoxia amongst excitatory neurons of different hippocampal regions (CA1, CA3, dentate gyrus). All clusters were randomly down-sampled to n = 2296 cells for better comparability. Right panel: Percentage of upregulated genes amongst all hypoxia-regulated genes; |log-fold change| > 0.25, p-adj < 0.05, correlation-adjusted Wilcoxon test. (d) Differential cell abundance testing with MiloR [20]. Red (= negative logFC) represents a numerical increase upon hypoxia in the respective neighborhood, blue (= positive logFC) indicates a decrease. Region marked in red specifies region of immature and intermediately mature neurons of CA1 increased in number under hypoxia. logFC: log-fold change, Nhood size: neighborhood size. (e) Beeswarm plot showing the numerical increases and decreases under hypoxia in the respective neighborhoods of each cell cluster. Red (=negative logFC) indicates an increase under hypoxia, blue (= positive logFC) a decrease. (f) Expression of immature and intermediately mature excitatory neuron markers. Red oval indicates again the interesting region denoted in (d) with increase in cell abundance upon hypoxia.

