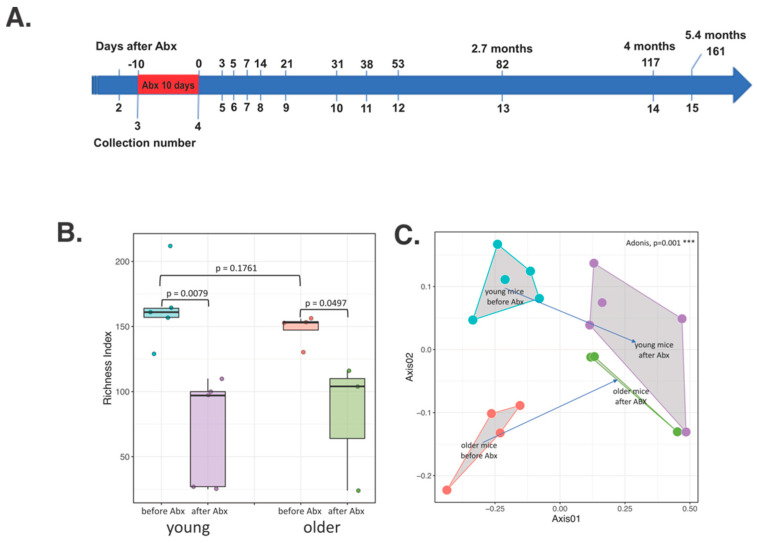
Figure 1.
(A) Sampling and antibiotic treatment schematic for 6 months. All of the mice were treated with the antibiotic cocktail for 10 days (red) and stool samples were collected as shown by the collection numbers. The numbers above the time scale depict the day since the antibiotic treatment, whereas the corresponding collection number below depict when the samples were collected. (B) Box plot of amplicon sequence variant (ASV) richness in young and older mice before and after 10 days of antibiotic treatment. Points represent the ASV richness of each mouse gut microbiota sample. P-values were calculated with the Mann-Whitney test. (C) Bray-Curtis based non-metric multidimensional scaling (NMDS) plot of distances between young and older mice before and after antibiotic treatment.

