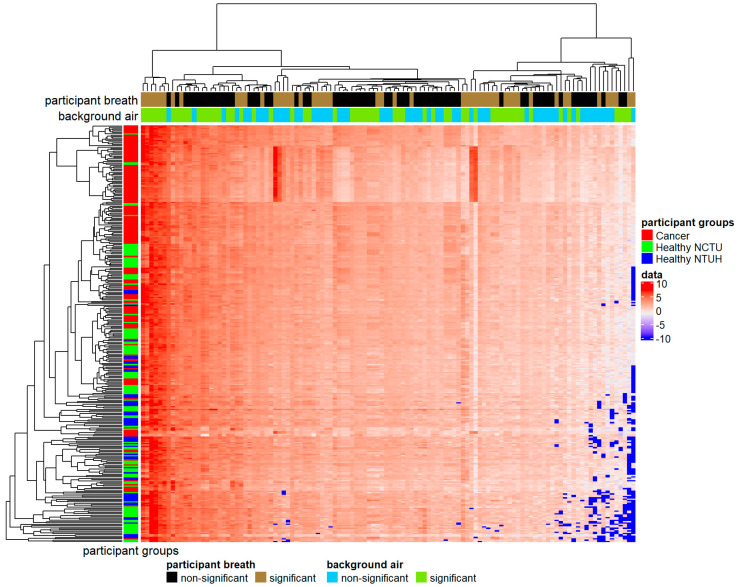
Figure 2.
The heat map of 116 volatile organic compounds (VOC) measurements (log concentrations) for 316 participants. In the color matrix at the center, each row represents a participant, and each column represents a single VOC with the diverging color scheme of red (high concentration) and blue (low concentration). VOCs and participants are clustered using the agglomerative hierarchical clustering method. In the color bar on the left, red indicates cancer patients, green indicates healthy volunteers of the National Yang Ming Chiao Tung University (NCTU), and blue indicates healthy volunteers of the National Taiwan University Hospital Hsin-Chu Branch (NTUH). The two-color bars at the top represent the significance of VOCs. The first bar indicates whether VOCs showed significant differences between lung cancer patients and healthy controls (brown for significant and black for nonsignificant). The second bar indicates whether VOCs were significantly different between NCTU and NTUH (green for significantly different and blue for not significantly different).

