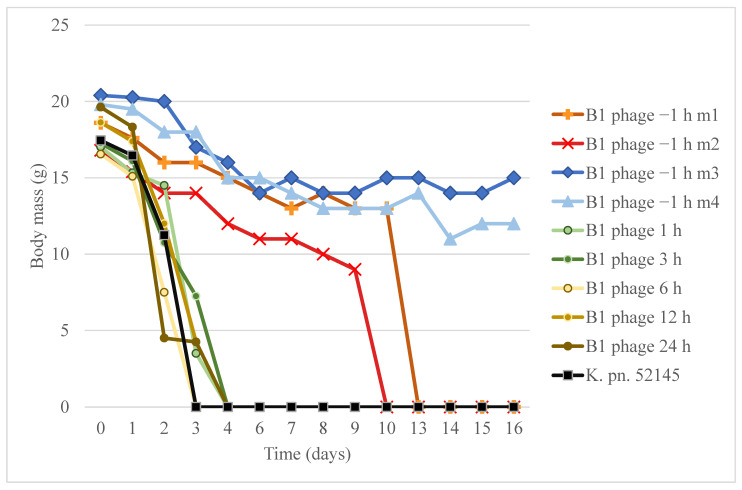
Figure 7.
Comparison the therapeutic and preventive effect of B1 phage in frame of survival and bodyweight in a murine nasal infection model. The graph shows body mass of mice from the start of nasal cavity infection over 16 days. Body mass in groups of therapeutic phage administrations (B1 phage 1 h, 3 h, 6 h, 12 h, 24 h) and in the K. pneumoniae 52145 infection positive control (K. pn. 52145) are shown as the mean of four mice from the same group. Body mass graphs of mice in the preventive phage administered group (−1 h) are indicated individually (B1phage −1 m1, m2, m3, m4).

