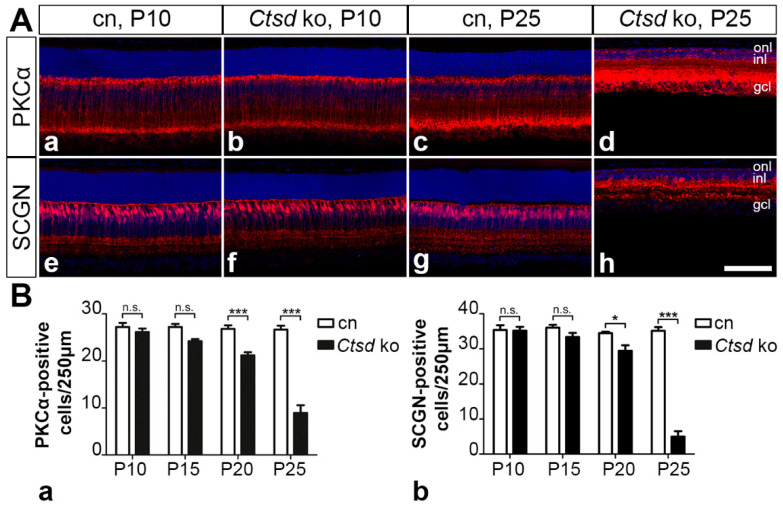
Figure 7.
Degeneration of rod and cone bipolar cells. (A) The density of PKCα-positive rod bipolar cells and SCGN-positive cone bipolar cells in P10 Ctsd ko mice (Ab,Af, respectively) was similar to that in age-matched control mice (Aa,Ae, respectively). A pronounced loss of rod and cone bipolar cells was evident in 25-day-old mutant retinas (Ad,Ah, respectively) when compared with control retinas (Ac,Ag, respectively). (B) Quantitative analyses of mutant (filled bars) and control retinas (open bars) revealed a significant loss of rod (Ba) and cone bipolar cells (Bb) starting from P20. Each bar represents the mean value (±SEM) of 6 animals. n.s., not significant; *, p < 0.05; ***, p < 0.001, two-way ANOVA. cn, control; gcl, ganglion cell layer; inl, inner nuclear layer; ko, knock-out; onl, outer nuclear layer; P, postnatal day; PKCα, protein kinase C alpha; SCGN, secretagogin. Scale bar: 100 µm.

