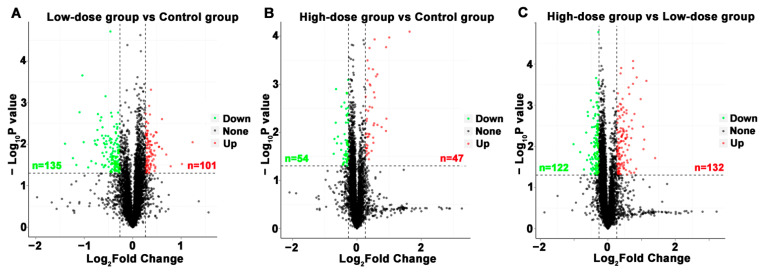
Figure 2.
The volcano plots of differentially expressed proteins (DEPs) between different groups. (A) low-dose group vs. control group. (B) high-dose group vs. control group; (C) high-dose vs. low-dose group. Significant difference for the p value on vertical ordinate (Base 10 logarithmic transformation). Red dots represent up-regulated; green dots represent down-regulated; black dots represent no significant difference.

