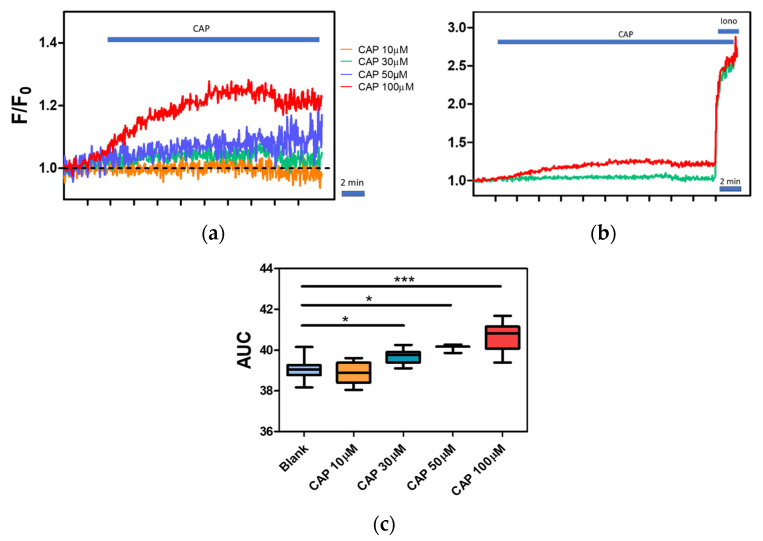
Figure 6.
Capsaicin dose–response of the canine PBMC. (a) Calcium traces of the canine PBMC treated with different CAP doses. An increase in fluorescence intensity was observed with increasing agonist (CAP) concentration. (b) Administration of ionomycin in the final concentration of 1ng/mL led to a further increase in fluorescence intensity. (c) Significant increase in intracellular calcium levels was observed in groups treated with 30, 50, and 100 µM CAP concentrations when compared to control. No effect was observed in the group treated with 10 µM CAP. Data are shown as a dot plot with mean ± s.e.m of AUC (from first 2 min), n = 3–8. Significant differences were denoted with asterisks, depending on the p- level: * p < 0.05, *** p < 0.0001 (one way ANOVA, followed by Tukey’s post hoc).

