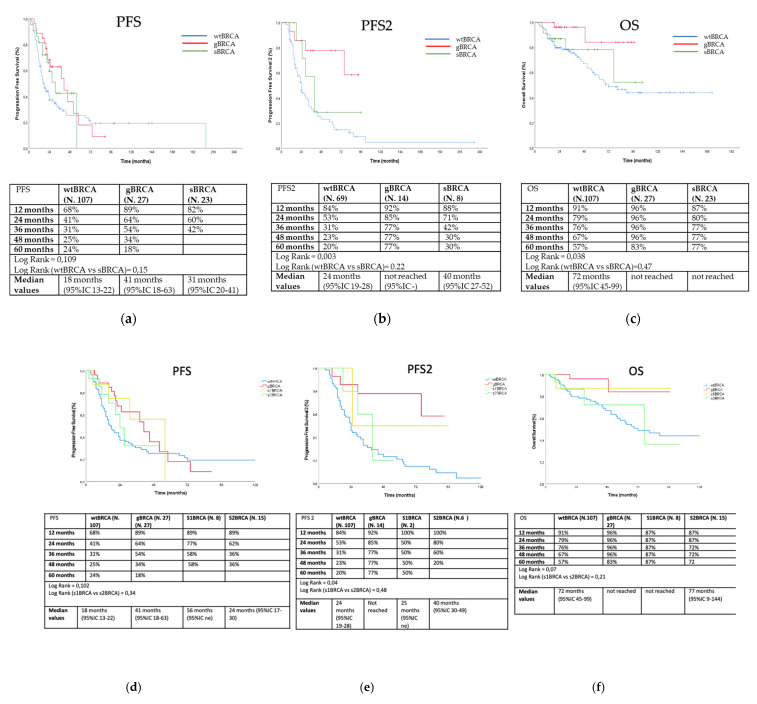
Figure 1.
Outcome analyses of PFS (a,d), PFS2 (b,e), and OS (c,f) according to subgroups in the overall population (blue line for wtBRCA, red line for gBRCA, dark green line for sBRCA, yellow for s1BRCA, and light green line for s2BRCA). PFS: progression-free survival; PFS2: progression free survival 2; OS: overall survival; wtBRCA: wild-type BRCA; gBRCA: germline BRCA; sBRCA: somatic BRCA; s1BRCA: somatic SNVs/indels of BRCA; s2BRCA: somatic CNVs of BRCA.

