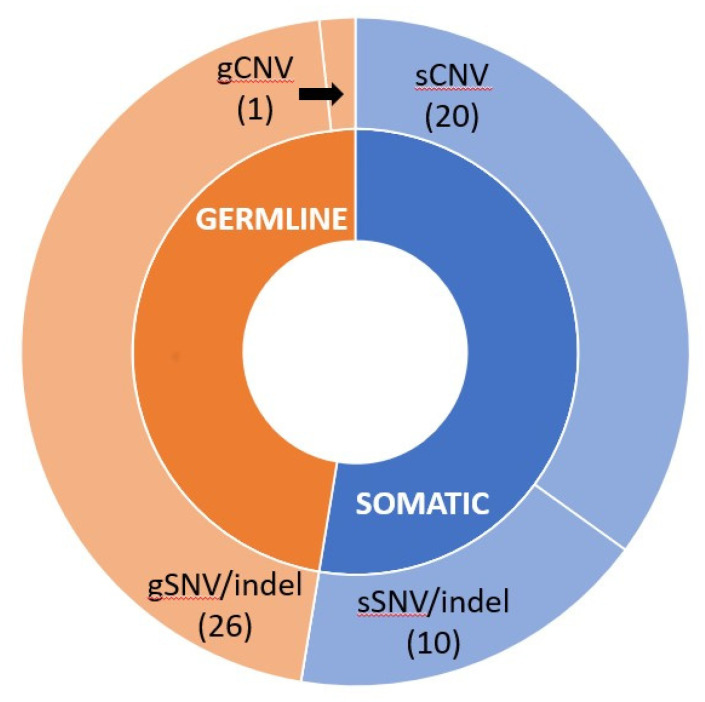
Figure 3.
Hierarchical donut chart of likely pathogenic or pathogenic gBRCA and sBRCA variants. The graph shows the origin of mutations found in the inner circle (orange for germline, blue for somatic) and the kinds of variants (CNV or SNV/indel) in the outer circle. Numbers refer to the amount of likely pathogenic or pathogenic variants detected. CNV: copy number variation; SNV: single nucleotide variant.

