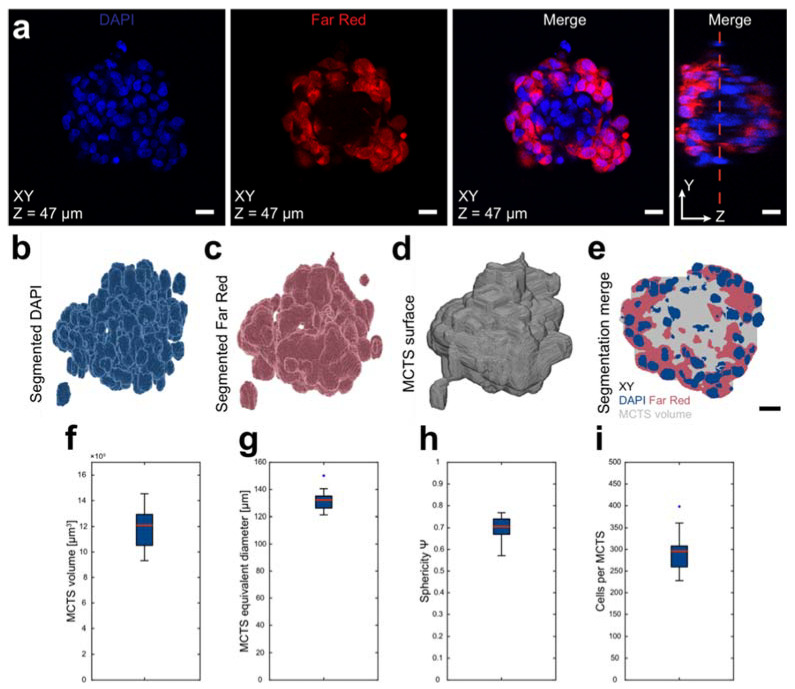
Figure 2.
Raw data, segmentation strategy and core-shell MCTS characteristics. After 48 h (24 + 24 h) of USW formation, the core-shell MCTS were fixed, stained with DAPI (Invitrogen) and cleared. All cells were stained with DAPI while cells in the shell were identified by Far Red staining (a). The red dotted line in the YZ plane indicates the XY optical section. Using a local adaptive thresholding algorithm, the DAPI (b) and Far Red (c) were segmented and used to approximate the MCTS surface and full volume (d). An XY-section in the merged segmented volume is shown as reference (e). The MCTS surfaces from 20 MCTSs imaged by confocal microscopy were used to measure layered MCTS volume (f), which has an equivalent diameter of a sphere with the same volume as the MCTS (g) and sphericity Ψ (h). Using the median nucleus volume after a watershed algorithm in the segmented DAPI, the number of cells was estimated as total DAPI volume divided by the volume of a single nucleus (i). Boxplots show the 25th and 75th percentiles with a red line marking the median value. The whiskers show the furthest observation 1.5 times the interquartile length away from the box edge while outliers are marked with a blue dot. Scalebars are 20 µm.

